Pedigree charts are one of the most requested topics that we get from visitors to our website. We have built a guidance document below that will be continually updated. You can also view it on Google Docs.
GLSEN Gender Triangle - Graphic and Education Guide

GLSEN and interACT developed the Gender Triangle as an educational tool to highlight the main components that revolve around gender identity—our bodies, how we use our bodies to express ourselves, and how the world around us reads our bodies based on the cultural and social codes of our time and place.
Diverse Families Toolkit: There’s More Than One Way To Make a Family

This poster provides an important clarification when learning about biology - that our biological or genetic concept of family may be different from social or legal understandings of family. You can teach your students that all families are valid using this poster or other resources in the Gayby Baby Project’s Diverse families Toolkit.
Gynandromorph Animals - BBC Earth article

This BBC Earth article explores the rare phenomenon of bilateral gynandromorphs, or animals which develop different physical sex characteristics on their left and right side. This occurs when a cycle of meiosis yields multiple viable eggs rather than one egg and three polar bodies to be discarded. When two eggs are fertilized by sperm, mosaicism can occur in the sex chromosomes.
When introducing students to the article, the teacher should be sure to note that overgeneralizing language is briefly used to describe humans (“In humans, men have an X and a Y chromosome, while women have two X chromosomes.”) However, the article can still have value in demonstrating the nonbinary nature of biological sex and the scientific processes by which evidence is gathered to support this.
A Reddit post shows a gynandromorph lobster found in the wild:
Video: One of a Kind
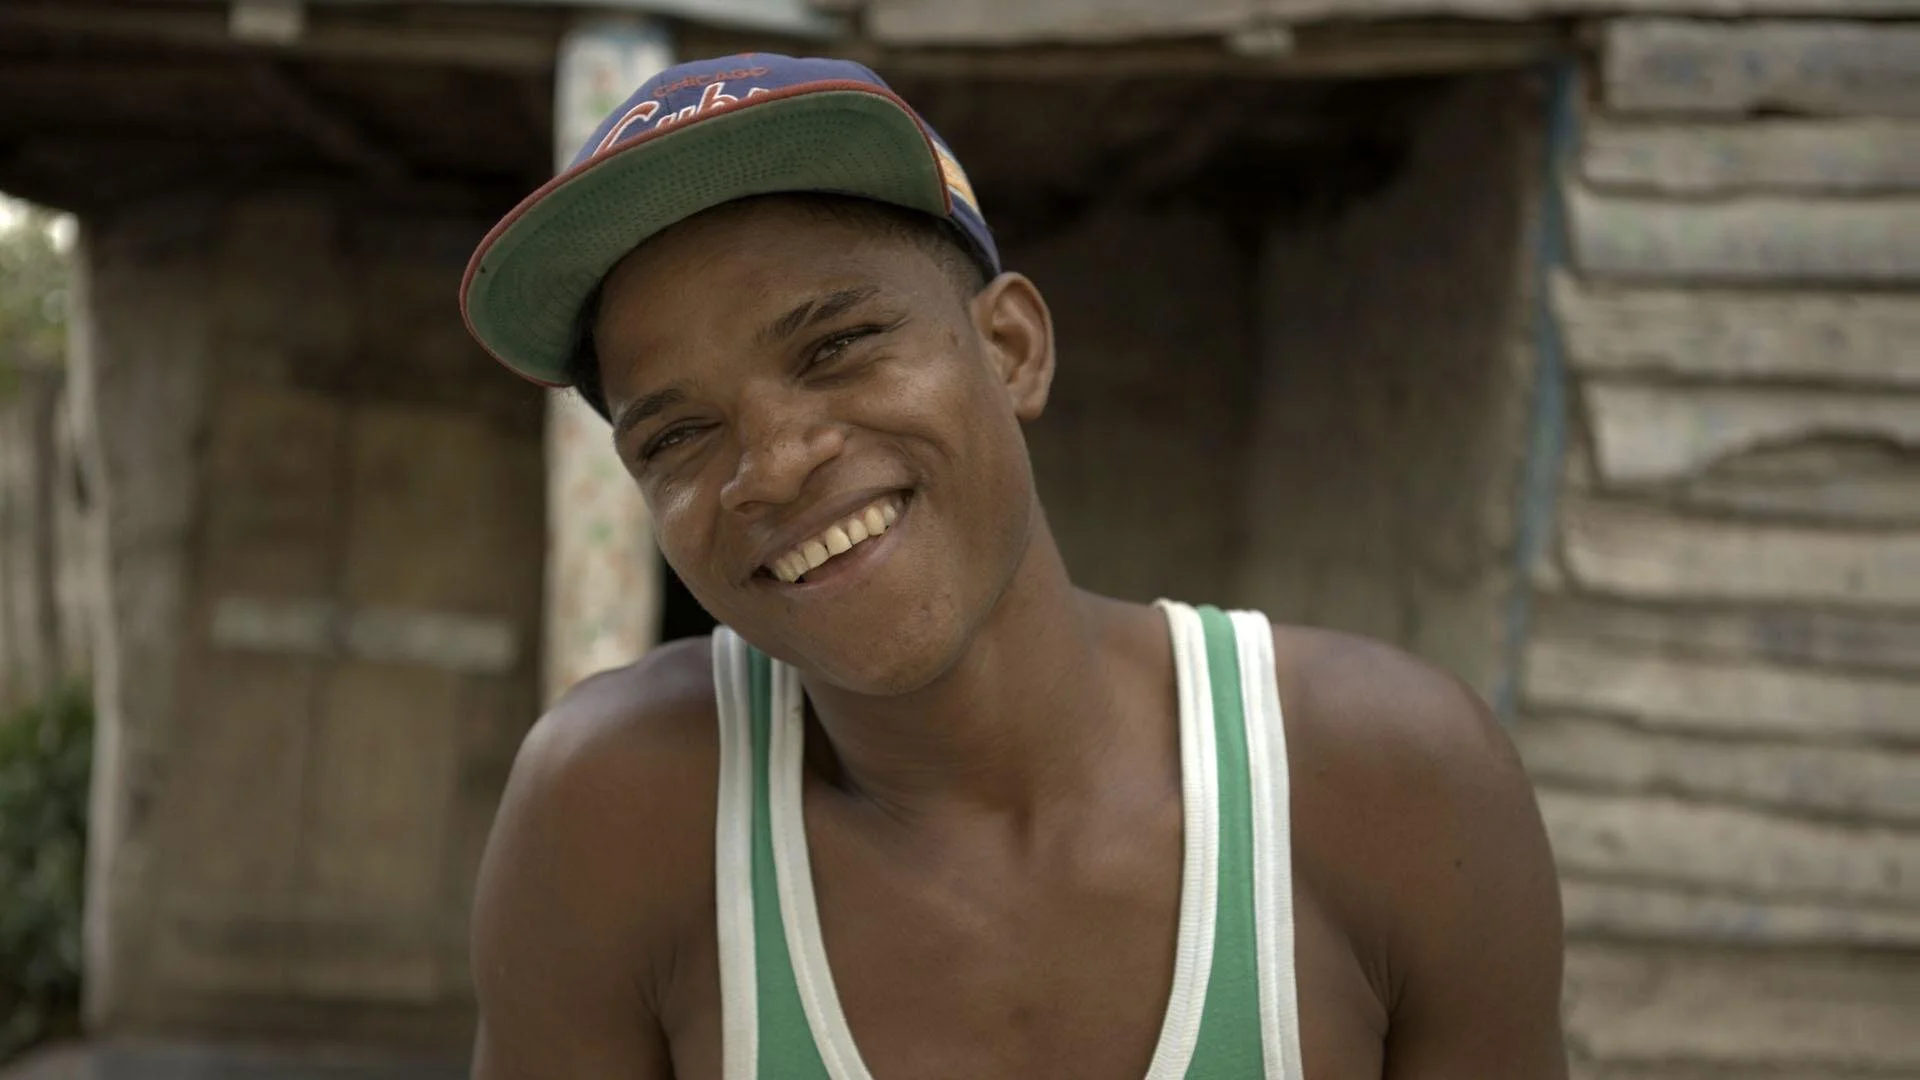

This is the second episode of the PBS documentary series “9 Months That Made You.” The episode uses family interviews, documentary footage, and computer animations to detail the relationship between genetic and phenotypic variations in humans. Among those featured is güevodoces, a specific intersex trait observed in the Dominican Republic. We felt that the individuals were portrayed with empathy and autonomy, and using modern language. As a post-viewing exercise, students may discuss the various choices of language used to describe variation within the episode.
The güevodoces clip can be streamed for free on Vimeo. The entire episode can be streamed for free on Kanopy with a public library card or university login. It is also available with a paid subscription on Netflix and PBS as of the time writing this post.
Pigeonetics Game
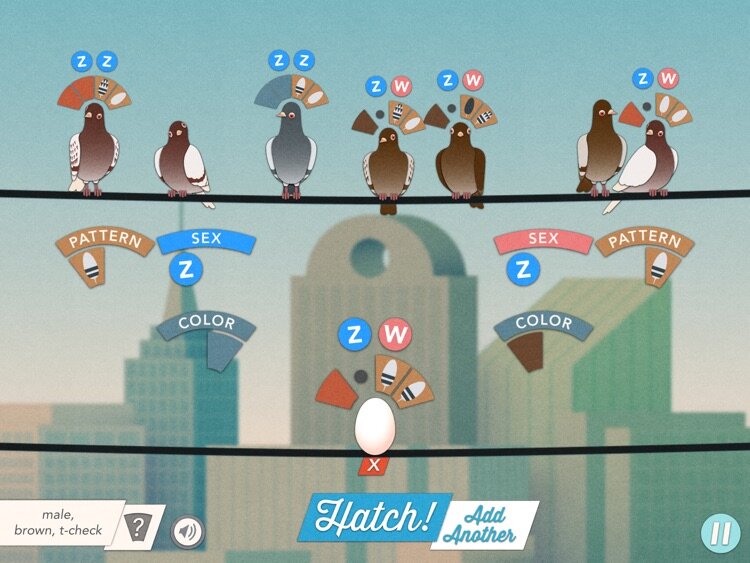
Pigeonetics is a game developed by the University of Utah Genetic Science Learning Center for web browser and mobile devices (iOS and Android). Players complete pigeon breeding challenges through trial and error. Students use evidence to learn the patterns of simple genetic inheritance, sex chromosome inheritance, and eventually incomplete dominance with dilution.
As curators of gender-inclusive resources, we like this game because it accurately portrays sex in animal species without conflating sex with gender or anthropomorphizing the animals. It also comes with a teacher guide.
Northwest Conference on Teaching for Social Justice 2020 (Online)

We are excited to return to the Northwest Conference on Teaching for Social Justice for a second year presenting "Gender Diversity in the Biology Classroom: Small Tweaks and Big Shifts".
Colorado Science Conference 2020 (Online)

We are returning to the Colorado Science Conference for a second year presenting "Gender Diversity in the Biology Classroom: Small Tweaks and Big Shifts". Our session takes place at 2:00 pm Mountain time on Saturday, November 14, 2020.
Kansas Association of Biology Teachers 2020 Conference (Online)

We will be part of a fantastic lineup of virtual workshops at the KABT 2020 Online Conference. Our presentation "Gender Diversity in the Biology Classroom" will begin at 10:50 am Central time on Saturday, September 12, 2020.. You can access event info, our slide deck, and the video from our presentation below.
National Association of Biology Teachers 2020 Conference (Online)

We have the privilege of delivering a virtual workshop at the NABT 2020 Online Conference. Our presentation "Gender Diversity in the Biology Classroom" is at 2:00 pm Eastern time on Friday, November 6, 2020. You can access event info, our slide deck, and the video from our presentation below.
Neuroendocrinology (Sex & Gender) with Daniel Pfau: Interview on Ologies Podcast

In this 2020 episode, Ologies podcast host Alie Ward interviews genderqueer researcher Dr. Daniel Pfau. Dr. Pfau talks extensively about gender in biology, including queer behavior in animals, how hormones influence the brain, the variation of gender expression, how a strict gender binary is harmful to entire populations, hormone replacement therapy, and hormones in sports. The episode page includes streaming for Parts 1 and 2, as well as a transcript and show notes.
In 2024, Dr. Pfau returned for an encore episode!
Gender and Sex – Transgender and Intersex (Book Chapter)

This UMass Amherst textbook chapter models the use of precise, modern, and non-pathologizing language for discussing transgender and intersex topics in the context on human biology. The textbook authors are Miliann Kang, Donovan Lessard, Laura Heston, and Sonny Nordmarken. The chapter is available through Openbooks under a Creative Commons Attribution license.
Teaching about Gender Diversity (Book)

Written by teacher for teachers, Teaching about Gender Diversity is an edited collection of interdisciplinary lesson plans that provides K–12 teachers with the tools to implement gender-inclusive practices into their curriculum and talk to their students about gender and sex. Edited by Susan W. Woolley and Lee Airton, this engaging collection features teachers' perspectives on teaching about gender from across North America. Divided into three sections dedicated to the elementary, middle, and secondary grade levels, this practical resource provides lessons for a variety of subject areas, including English language arts, STEM, and health and physical education. To view more titles in Education, visit canadianscholars.ca.
Fred Hutch Science Education Partnership Workshop
This workshop was presented by Lewis Maday-Travis for the Fred Hutchinson Cancer Research Center's Science Education Partnership program on June 3, 2020. The workshop covers the basics of a framework for gender-inclusive biology education. All resources used in the workshop are available at: http://bit.ly/SEPgender
Gender Spectrum Online Professionals' Symposium 2020

We are so excited to give a virtual workshop at Gender Spectrum’s Professional Symposium. Our presentation is titled "Gender Diversity in the Biology Classroom: Small Tweaks and Big Shifts". You can access event info, our slide deck, and the video from our presentation below.
Pathways STEM Outreach Program
This is a unique STEM outreach program for LGBTQ+ high schoolers. Please share with students who may be interested! Sam Long will lead a workshop about diversity in biology in the July session.
--------
Calling all LGBTQ+ high schoolers! Wanna learn about LGBTQ+ scientists, build STEM skills, and meet other students this summer? Check out the new Pathways in STEM summer outreach program at CU Boulder! All events are online over summer 2020.
Info and registration at http://bit.ly/pathwaysstem


BSCS Presentation - April 15, 2020

Video: Are There "Male" and "Female" Brains?

This SciShow video reviews data concerning differences in the brains of biological males and biological females. The writers are careful to mention that research on this topic does not account for transgender or intersex individuals, and that neuroscience research as a whole is heavily focused on studying the brains of male humans and animals. You may also wish to discuss with students about the definition of “biological sex” and how that definition has changed throughout history.
Glossary resources, sports access, and new podcast appearances [Apr]

Hello, educators! You are in our thoughts during this challenging time. Here is our newsletter for April 2020.
Hi, everyone!
You are in our thoughts during this challenging time. Though we are physically isolated from our students and each other, the Gender-Inclusive Biology team would like to share gender-inclusive resources for remote learning and support.
Please email us if you have other suggestions or are seeking help.
Check the end for an invitation to the first of a series of informal social hours on Zoom.
Useful gender-inclusive resources for teaching remotely: Here are a few assets that we think will be useful for teachers distributing lessons remotely during this time. Please email us if you have other suggestions to add to this list!
Activity: Sex verification in athletes This activity guides students through analyzing data and the history of how sex verification in athletes has changed over time. When using with students, you can emphasize the idea that "biological sex" is an ambiguous, non-scientific term with a definition that has changed over time.
Video: There are more than two human sexes This engaging video (mostly geared towards the high school level) is a great introduction to diversity of sex characteristics and distinguishes the differences between sex and gender identity.
Video: Secrets of the X Chromosome This video and lesson addresses the differences between sex chromosomes and autosomes, including high-engagement topics like colorblindness, identical twins, and cats, all while approaching sex and gender using more accurate language than most online resources.
Gender-inclusive Biology Talkspace/Social hour: We will be hosting our first informal check-in space for educators interested in Gender-Inclusive Biology on Thursday, April 16th at 3 PM Pacific/6 PM Eastern via Zoom. If you are interested in joining us, please email Lewis (fishyteaching@gmail.com) for the link to join in!
Upcoming appearances:
Many in-person conferences have been canceled in the coming months. However, there are some exciting opportunities to connect with Gender-Inclusive Biology Education and related work in online and remote settings.
Sam gave a 30-minute webinar about Gender-Inclusive Biology on the STEM Village on Monday, April 6th - you can check out the video recording here!
Jamie Kubiak, a chemistry teacher in New York City, gave a recent webinar on creating LGBTQ-inclusive classrooms. You can view the recording and see the slide deck here.
Sam has been doing a Twitter series focused on dispelling common stereotypes and misconceptions about Asian-Americans by sharing his own stories and the stories of Asian-American heroes in STEM and beyond. You can check the project out using the hashtag #ExpectAsianVsReality
Sincerely,
Lewis, Sam, and River
The Gender-Inclusive Biology Team
What We Wish Our Teachers Knew - Brochure from InterACT Advocates

This brochure gives best practices for educators addressing the topic of intersex in classrooms, sex education classes, and school health centers. This resource was created by InterACT Youth and informed by their personal experiences.